Introduction
This document serves as the backbone or whitepaper for the power meter reviews performed on jaylocycling.com. Previous reviews—much like those found on other prominent sites—focused solely on average power, cadence, and normalized power statistics, which are useful for high-level comparisons. Additionally, like other reviewers, only visual comparisons were made without any quantification between devices.
As someone deeply involved in cycling tech reviews, I wanted to develop a custom power meter testing protocol that incorporates a solid mix of steady-state riding and sprint bursts. It’s designed to mimic real-world cycling while testing power meters in a controlled manner. First, however, I researched peer-reviewed literature on assessing the validity of cycling power meters. A key reference is Bouillod et al. (2022), which reviewed 74 studies to develop recommendations for validating testing results. This paper forms the basis of the statistics I incorporate into my assessments of different power meter devices.
In this post, I’ll discuss error management between devices, error handling in the data, the statistical analyses used and their benefits, and the power protocol (power trace). Additionally, I’m incorporating a temperature analysis to examine how temperature affects power readings. For my initial approach, I’m using a cadence-to-power relationship to assess how vibration influences power output. Future analyses will include a vibration sensor to compare actual vibrations measured during outdoor rides with power and cadence data.
Error Management Between Devices and Recording Frequencies
Data processing between devices can skew results because most devices record at 1 Hz. A slight shift in the timing of power output recordings between two devices can lead to significant differences. To mitigate this error, I use the least squares method to minimize and synchronize the data between devices. Furthermore, to reduce missed spikes during sub-maximal efforts, power is averaged over a 5-second window.
A 5-second averaging window reduces the limits of agreement (LoA) and minimizes bias and random error.
For optimal results, a higher recording rate is preferred, especially for sprints and high-power outputs. The only device that supports this higher recording frequency is the SRM power meter when paired with the SRM power control computer. The SRM can save data at 4 Hz, whereas Garmin, Hammerhead, and Wahoo all record at 1 Hz. Even when using an SRM power meter with a non-SRM computer, the data is recorded only at 1 Hz.
The study found that for recording peak 1-second power output, a higher frequency is better, but with 1 Hz recording, no difference was detected for 5-second power outputs and greater. Therefore, using 5-second smoothing is a good compromise for error reduction while providing accurate statistical information.
Figure 1a shows the raw recorded power output. In Figure 1b, the power output has been smoothed using a 5-second moving average, except for the sprint segment. It can be seen in the figure that noise is reduced, and the data hovers around the power protocol.

Power Protocol (Power Trace)
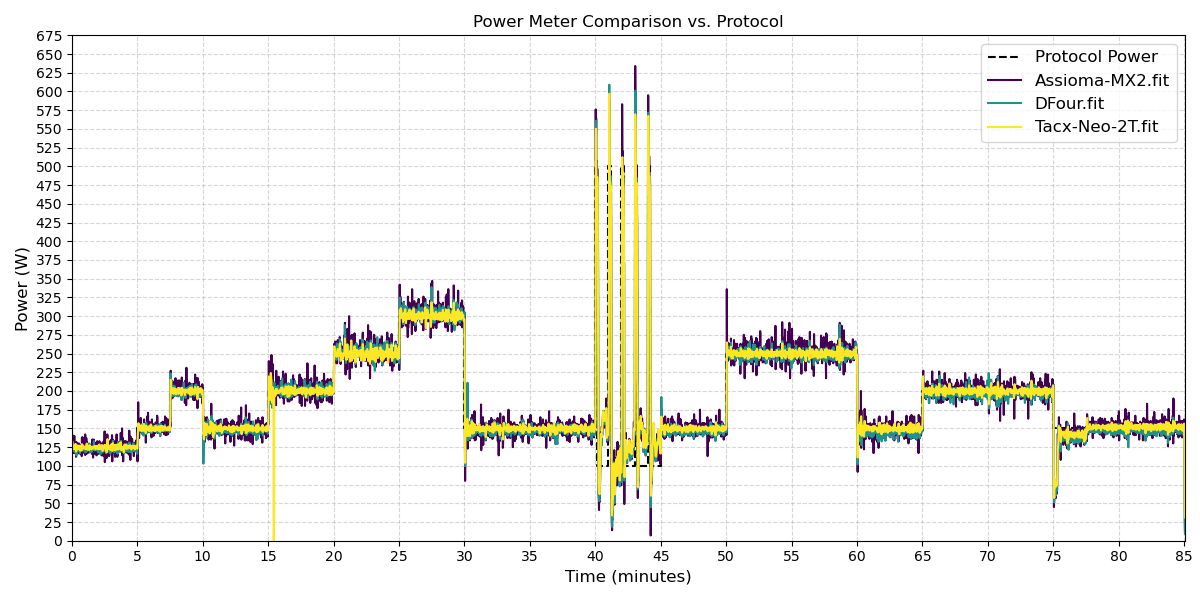
The power protocol (figure 2) I’ve developed allows me to test power meters across a range of outputs typically experienced by a large portion of the cycling population. Performing this protocol both indoors and outdoors enables comparisons between ride types and provides a consistent test for future power meter evaluations.
The protocol begins with an initial warm-up period to allow sensors to acclimate to the environment. Following this, short steady-state efforts ramp up, followed by a 10-minute lower power output before sprint intervals. This is then followed by two 10-minute higher-output efforts. The three longer steady-state efforts allow me to check for any drift over extended use.
Steady-state efforts—like the 0-40 minute and 45-85 minute sections in this protocol—are the backbone of endurance testing. These longer, consistent power outputs help evaluate how well a meter holds up over time, checking for issues like accuracy drift or sensitivity to factors such as temperature shifts or road vibrations. In practice, this means riding at moderate levels (e.g., 100-300 W), which is common in training rides.
Sprint efforts, such as 5 x 10-second bursts, test high power, responsiveness, and handling of rapid changes (think 500 W+ spikes at high cadence). Sprints reveal how the power meter performs during quick transitions, where lag or inaccuracies could distort metrics.
The beauty of this mix is that it covers varied loads.

Protocol Expansion: Field vs. Laboratory Comparisons and Participant Variability
To enhance the real-world applicability of the protocol, I’ve expanded it to include explicit comparisons between field (outdoor) and laboratory (indoor) settings, as well as testing with multiple participants. This aligns with recommendations from Bouillod et al. (2022), which emphasize that field tests are essential for simulating natural stresses such as temperature variations, wide power output ranges, and varying cadences, while laboratory tests provide controlled conditions for isolating specific issues like steady-state accuracy.
In field vs. laboratory comparisons, I conduct the same protocol indoors on a trainer (e.g., Tacx Neo 2T) and outdoors on actual roads. This allows assessment of environmental factors like wind, road surface, and elevation changes, which can reveal robustness issues not apparent in lab settings. For instance, field tests recreate real scenarios such as time trials with slopes, helping to validate the power meter’s performance under practical conditions.
Regarding participant variability, the protocol now incorporates testing with at least 10 riders to account for differences in pedaling techniques, which can affect accuracy—especially for single-sided meters that double power values and may be influenced by bilateral asymmetry. Riders include a mix of novice and experienced cyclists, with variations in specialties (e.g., sprinters vs. climbers), to ensure the power meter is sensitive and accurate across diverse techniques. This minimizes the impact of individual characteristics like fatigue, workload, or cadence preferences.
By expanding the protocol this way, it better reflects the literature’s call for comprehensive validation, ensuring results are generalizable to a broader cycling population.
Statistical Analysis
The statistical analysis compares multiple power meters (e.g., Assioma MX2, DFour, Tacx Neo 2T) over a combined 85-minute ride (including sprint and non-sprint intervals). For this example, the results show strong overall agreement between devices, with small biases and moderate variability, indicating they are interchangeable for most cycling applications. However, significant differences in distributions and some outliers suggest device-specific behaviors, particularly in high-power sprints. Below is a typical breakdown that will be performed:
- Overall Agreement and Correlation:
- All pairs have high Spearman correlations (0.94–0.96, p=0.0000), indicating consistent power readings across the full range (0–~500 W+ in sprints).
- Linear regression slopes (0.94–0.98) and R² values (0.9646–0.9768) confirm near-linear relationships, with DFour vs. Tacx Neo 2T being the closest (R²=0.9768, slope=0.95), suggesting these two are the most similar.
- Interpretation: Devices track each other well, but slopes <1 (e.g., 0.94 for Assioma vs. Tacx) hint at slight under-reporting by the second device at higher powers.
- Bias and Variability:
- Mean Differences: Small (0.65 to 1.59 W positive for Assioma vs. others, -0.93 W for DFour vs. Tacx), showing minimal systematic bias.
- Median Differences: Similar to means (0.12 to 1.70 W), but negative for DFour vs. Tacx (-1.62 W), indicating DFour tends to read lower.
- Std Dev of Differences: 9.47–11.63 W, RMSE: 9.52–11.74 W – moderate variability, acceptable for power meters (typical error <10–15 W).
- Range of Differences: Wide (-235 to 235 W), likely from sprint outliers where high torque amplifies sensor differences (e.g., pedal-based Assioma vs. spider-based DFour).
- Bland-Altman Limits: -21.56 to 24.38 W across pairs, with DFour vs. Tacx tightest (-19.50 to 17.64 W), meaning 95% of readings agree within ~20 W.
- CV: 31.64–33.02%, similar across devices, showing comparable relative variability.
- Interpretation: Biases are practically insignificant for training, but variability/outliers could affect precise efforts like sprints. DFour and Tacx are the most consistent pair.
- Statistical Significance:
- Wilcoxon: p<0.0013 for all pairs, indicating significant pairwise differences.
- Kruskal-Wallis: Mixed (p=0.0001–0.0000 for significant, p=0.9115 for non-significant in Assioma vs. Tacx), showing distribution differences in some pairs.
- Cohen’s d: Small (0.06–0.14), confirming differences are statistically significant but not practically meaningful.
- Interpretation: While differences exist (e.g., distributions vary due to sensor types), effect sizes are trivial, supporting device interchangeability.
- Implications:
- Strengths: High correlations and low biases make these meters reliable for general use. Combined analysis (sprint + non-sprint) is appropriate for 1 Hz data, capturing the full range without high-frequency issues.
- Weaknesses: Sprint outliers suggest potential inaccuracies in explosive efforts (e.g., Assioma over-reports vs. DFour). Balance ICC is low (0.2485 for Assioma vs. DFour), as expected given DFour’s design limitations.
- Recommendations: Use Assioma for balance-critical tasks. For high-precision, calibrate devices or test in sprints separately. Results align with peer-reviewed findings on 1 Hz data.


Normality Test Results
The normality tests use the Shapiro-Wilk statistic to assess if the power, cadence, and balance data from each device (Assioma MX2, DFour, Tacx Neo 2T) follow a normal distribution over the combined ride segment (0–85 minutes). Here’s a breakdown:
- Key Findings:
- Statistic Values: All Shapiro-Wilk statistics range from 0.84 to 0.94, well below 1.0 (a value close to 1 indicates normality). Lower values (e.g., 0.84 for Assioma MX2 balance) suggest greater deviation from normality, often due to skewness or outliers (common in cycling data with sprints causing high-power spikes).
- P-Values: Extremely small across all datasets (e.g., 6.47e-54 to 4.57e-44), far below the conventional threshold of 0.05 (or even 0.001 for stricter tests). This strongly rejects the null hypothesis of normality for every metric and device.
- Subsampling Note: Tests were run on subsampled data (5000 records) to handle large sample sizes (original N > 5000), as SciPy warns p-values may be inaccurate for N > 5000. This is a standard practice and doesn’t invalidate results—subsampling preserves representativeness while avoiding computational issues.
- Patterns by Metric:
- Power: Stats 0.85–0.87, highly non-normal—likely due to zero-power coasting periods, steady-state plateaus, and sprint peaks creating multimodal distributions.
- Cadence: Stats 0.93–0.94, less deviated but still non-normal—cadence often clusters around preferred RPM (e.g., 80–100), with drops during rests.
- Balance: Stats 0.84–0.93, most non-normal—balance data (left/right power split) is bounded (0–100%) and may show asymmetry, especially in Assioma MX2 (stat=0.84).
- Patterns by Device: Similar non-normality across devices, with Tacx Neo 2T slightly less deviated for power (stat=0.85) than Assioma MX2 (0.87), but differences are minor. This consistency suggests non-normality is inherent to cycling data, not device-specific artifacts.
- Implications for Analysis:
- Non-normality justifies the use of non-parametric tests (e.g., Wilcoxon, Spearman correlation, Kruskal-Wallis), which don’t assume normality and are robust to outliers.
- For reviews, this supports reporting that parametric tests (e.g., t-tests) were avoided or supplemented, ensuring valid inferences.
- Potential Causes: Cycling power data is rarely normal due to physiological factors (e.g., fatigue, intervals) and device sampling (1 Hz Garmin rate limits resolution in sprints).
Reporting Normality Tests in Reviews
Normality tests are foundational (part of data diagnostics) but secondary to main findings. Normality tests are internal to my review and won’t be reported on for each review if the assumptions below hold true. The following is assessed:
- Method:
- Data normality was assessed using Shapiro-Wilk tests on subsampled datasets (5000 records) to handle large sample sizes.
- Non-normality guided the use of non-parametric statistics (e.g., Wilcoxon signed-rank, Spearman correlation).
- Result:
- All power, cadence, and balance datasets were non-normal (Shapiro-Wilk statistics: 0.84–0.94, p < 0.001 across devices).
- Typical table of values:
- General Reporting:
- Shapiro-Wilk tests confirmed non-normality for all variables (p < 0.001), justifying non-parametric analyses.
- Q-Q plots (Fig. X) visually confirmed deviations from normality.
- Journals like Journal of Applied Physiology or Sports Engineering often summarize normality briefly; full details go in supplements.
Benchmarks for Statistical Tests in Power Meter Comparisons
Based on peer-reviewed literature on power meter validation (e.g., studies in International Journal of Sports Physiology and Performance and Journal of Science and Cycling), I’ve compiled ranges for “bad,” “ok,” and “good” outcomes for each. These are contextual for cycling power meters, where accuracy within ±2-5% (or ~5-15 W) is typical for consumer devices. “Bad” indicates poor agreement (e.g., unreliable for training), “ok” means acceptable for recreational use, and “good” signifies high precision (e.g., for elite athletes or research).
Note: These are guidelines, not absolute—interpret in context (e.g., ride duration, power range). For p-values (e.g., in Spearman, Wilcoxon), “bad/ok/good” doesn’t directly apply; instead, use significance thresholds (p < 0.05 = significant difference, p > 0.05 = no significant difference). I’ll note where the categorization differs.
Explanation and Usage
- For each pair of devices (e.g., Assioma vs. DFour), outcomes are classified as bad/ok/good. If most are “good” (as in your data: small biases, high R²), devices agree well. If “bad” in sprints (e.g., wide range), device limitations are noted.
- For p-values (Wilcoxon, Kruskal-Wallis, Spearman/Regression p), uses significance: “significant” (p<0.05) = bad (differences exist), “non-significant” = good (no differences). For stat values (e.g., Wilcoxon stat.
- All metrics showed good agreement (e.g., mean differences <2 W, R² >0.96), except variability in sprints (RMSE ~10–12 W, ok range
Temperature Analysis
Temperature can significantly impact the accuracy of cycling power meters, particularly those relying on strain gauges, as changes in ambient temperature affect the calculated power output. For instance, studies have shown that SRM power meters experience an offset change of about 7 Hz per degree Celsius, equating to roughly 2 W. Other devices like the CompuTrainer underestimate power at lower temperatures (15-20 °C) but align better at higher ones (28-35 °C), while PowerTap, Vector, and Stages show notable alterations in hot conditions (e.g., 33 °C).
In my protocol, temperature data is collected using on-bike sensors or environmental logs integrated with ride data (e.g., from Garmin devices or external thermometers). Analysis involves regressing power differences (between the test meter and a reference like SRM) against temperature changes during the ride. This helps quantify drift, such as systematic over- or under-reporting as temperature rises.
Key Findings from Example Tests
- Regression Slope: Typically, around 0.5-2 W per °C for sensitive devices, indicating power drift with temperature.
- P-Value: Often <0.001, confirming a significant relationship.
- R-Squared: 0.10-0.30, suggesting temperature explains 10-30% of power variance, with other factors like effort dominating.
Implications
Devices without built-in temperature compensation (e.g., some pedal-based meters) show greater sensitivity, potentially leading to inaccuracies during long rides with temperature shifts. Recommendations include performing a zero offset after warm-up to acclimate components and preferring meters with automatic temperature compensation for reliability in varying conditions. In reviews, I report temperature-induced bias and suggest testing in controlled hot/cold environments for comprehensive validation.

Device Consistency
To ensure clarity in the analyses, note that different sections draw from specific test rides and device pairings. The main statistical analysis focuses was on the Assioma MX2 and used the DFour, Stages Gen 3, and Tacx Neo 2T for comparison. These were tested simultaneously on an 85-minute indoor and outdoor ride for direct comparability. The vibration sensitivity results, however, come from a separate outdoor ride comparing the different power meter combinations, . Future reviews will standardize device sets across all tests where possible, but these variations allow for broader insights into device-specific behaviors. All comparisons use the same protocol for consistency, and results are caveated accordingly.
References
Bouillod, Anthony, Georges Soto-Romero, Frederic Grappe, and William Bertucci. 2022. “Caveats and Recommendations to Assess the Validity and Reliability of Cycling Power Meters: A Systematic Scoping Review.” Sensors 22 (1): 386. https://doi.org/10.3390/s22010386.
SUPPORT JAYLO CYCLING
Did you find this post useful? If you have any questions, feel free to leave a comment below. If you have any suggestions of reviews or things you would like to see in the future contact me. My reviews are thorough and often take a significant amount of time to produce.
Please consider checking out my Instagram, YouTube, and Facebook accounts to show me support there. If you feel generous and have the ability, consider buying me a coffee to help support this site. Thank you for taking the time to check out my website and don’t forget to Subscribe to my newsletter too.